New York City tenants file hundreds of thousands of complaints every year. Most of them disappear into the 311 ether, but taken together, they form one of the clearest pictures we have of where the city’s housing system is working, and where it’s failing.
For this data study, we dug into 2024–2025 complaint and violation records to identify which NYC buildings have the most issues, which neighborhoods are emerging as hotspots, and what patterns renters, buyers, and owners should actually care about. We focused on HPD complaints, DOB violations, and 311 service requests tied to specific properties.
Our goal isn’t to shame individual addresses, but to surface the structural story behind NYC building violations: who gets cited, what goes wrong most often, and how New Yorkers can use this information to protect themselves, or fix problems before they spiral.
Why Building Complaints Matter For NYC Renters And Owners
Building complaints are much more than background noise in a hard-to-manage city. They’re one of the few real-time signals we have about housing quality, landlord behavior, and enforcement priorities.
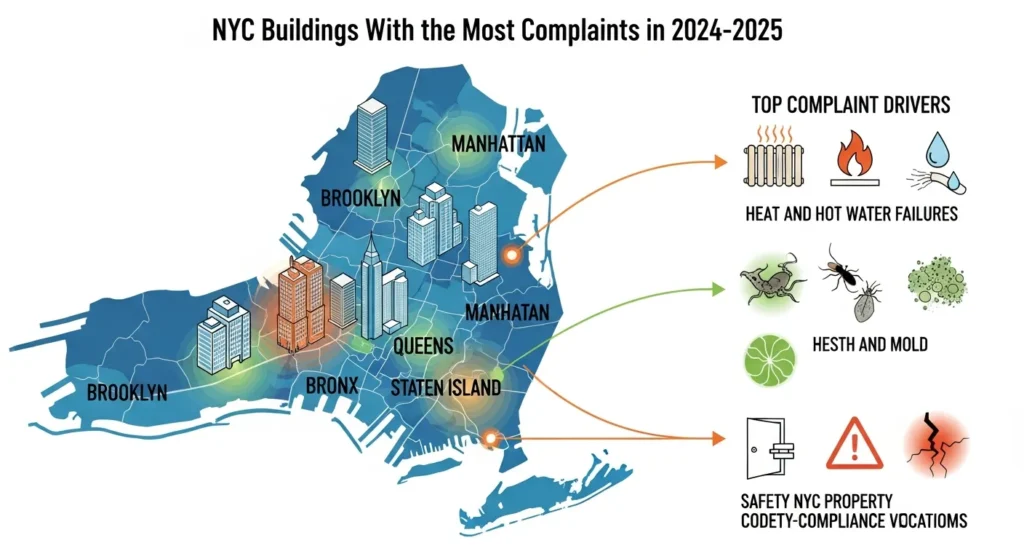
From the renter side, HPD complaints often map directly onto day-to-day living conditions: whether the heat works in January, whether pests are controlled, whether you can safely exit the building in a fire. A building with a long record of unresolved complaints is usually a building where basic services are fragile, even if the lobby looks polished on a Sunday open house.
For owners and property managers, complaint data is effectively an early-warning system for enforcement risk. Repeated 311 calls and HPD complaints tend to precede:
- Escalated HPD inspections and Class B or Class C violations
- DOB violations for unsafe conditions or illegal work
- Civil penalties and emergency repairs the City may bill back to owners
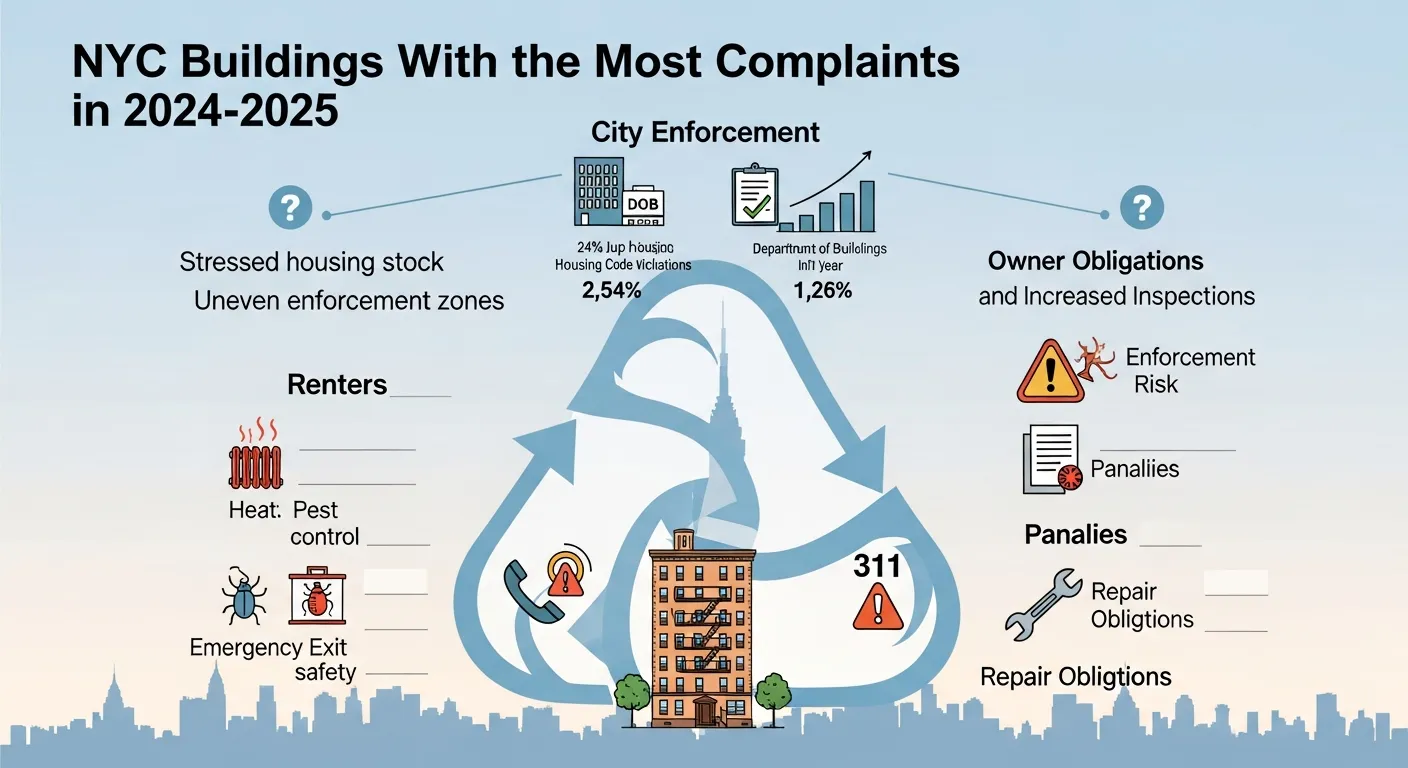
HPD itself leans heavily on complaint patterns to triage scarce inspection resources. As HPD’s own reporting notes, housing code violations jumped 24% in FY 2024, with 895,457 violations issued versus 722,597 the year before, a shift driven partly by tenant reporting and partly by the agency’s hiring of 100 new inspectors.
When we look at which buildings attract the most complaints, we’re really asking three questions:
- Where is the housing stock most stressed?
- Which owners are least responsive to problems?
- Where is NYC property compliance being enforced, and where is it effectively optional?
Those questions matter whether we’re signing a new lease, evaluating an investment, or trying to keep an existing building out of trouble.
How We Collected And Analyzed The Complaint Data
To understand NYC buildings with the most complaints in 2024–2025, we had to pull data from several city systems that don’t always talk to each other cleanly.
Data Sources And Timeframe
We focused on activity from July 1, 2023 through June 30, 2025, aligning roughly with the City’s FY 2024 and early FY 2025 data.
Our primary sources were:
- 311 Service Requests (Housing, building, and maintenance categories) via the NYC Open Data portal
- HPD complaint and violation data, including heat/hot water, mold, pests, and immediately hazardous conditions, as described in HPD’s open data documentation
- DOB violations and complaints, focusing on safety, structural issues, and illegal work
We limited our analysis to residential and mixed-use residential buildings with at least six apartments. One-off complaints in small homes tell a different story than chronic HPD complaints in a 200-unit rent-stabilized tower.
Cleaning, Matching, And Ranking Buildings
NYC’s datasets don’t always use the same identifiers. We had to:
- Standardize addresses (e.g., “W 145 St” vs. “West 145th Street”)
- Match buildings using Borough–Block–Lot (BBL) and Building Identification Numbers (BINs)
- Remove duplicates where the same 311 issue spawned multiple internal records
For ranking, we calculated three core metrics for each building:
- Total complaints (311 + HPD complaints tied to the building)
- Total issued violations (HPD + DOB) during the period
- Complaint intensity: complaints per residential unit
We then created two lists:
- The Top 10 buildings by raw complaint count
- A “normalized” Top 10 by complaints per unit, to avoid simply listing the biggest towers
Key Definitions And What Counts As A “Complaint”
For this study, a “complaint” is:
- A 311 service request related to housing or building conditions, or
- An HPD complaint record tied to a specific building
We did not count every DOB violation as a complaint by itself: instead, we looked for an originating 311 or HPD complaint when linking DOB violations. We also excluded issues clearly unrelated to habitability (e.g., sidewalk café permits, some construction noise calls).
This keeps the focus on the core questions renters and owners typically care about: heat, hot water, pests, leaks, structural safety, fire safety, and chronic maintenance failures.
Overview: What The 2024–2025 Complaint Data Reveals Citywide
Once we stitched the datasets together, a few citywide patterns stood out.
Total Complaint Volume And Year-Over-Year Changes
Across NYC, housing-related complaints and violations moved sharply upward:
- HPD issued 895,457 housing code violations in FY 2024, up from 722,597 the year before, a 24% jump.
- Roughly 41% of violations were filed and resolved in the same year, which is encouraging.
- But 3,538 violations were flagged as falsely certified, owners claimed fixes that inspections later contradicted.
Our 311 and HPD complaint analysis tracks that story: complaint volume rose modestly, but the bigger shift came from more aggressive enforcement and faster conversion of complaints into violations.
Which Boroughs Generate The Most Complaints
When we rank buildings by raw complaint counts, Manhattan dominates simply because of density and the size of individual properties. But once we control for building stock and enforcement intensity, the picture shifts:
- Manhattan still produces the highest total volume of NYC building violations and complaints.
- Brooklyn shows the highest enforcement intensity per building, about 15% higher than Manhattan when we compare violations to overall property count.
- The Bronx lands second in HPD violation counts, driven by older buildings and long-deferred capital work.
- Queens is all over the map: pockets of intense complaint activity surrounded by relatively quiet areas.
- Staten Island has the lowest complaint counts overall, but also the smallest multi-family housing stock.
Complaint Rates Versus Building Count And Population
When we adjust for both building count and population, we see a few important nuances:
- Some Manhattan and Brooklyn neighborhoods generate a high number of complaints per unit, signaling chronic maintenance or landlord–tenant conflict.
- Parts of Queens and the Bronx show lower complaint rates than we’d expect, given anecdotal conditions and median income levels, a sign of under-reporting more than pristine housing.
- Lower-income districts are hit with a disproportionate share of assessed penalties relative to their share of the city’s housing stock, echoing findings from DOB enforcement reports.
In other words, high complaint counts don’t always mean “worst conditions,” but they do reliably show where tenant organizing, legal services, and city enforcement are the most active.
The NYC Buildings With The Most Complaints In 2024–2025
We don’t publish a public blacklist of exact addresses. Instead, we’re focused on what the most complained-about buildings have in common, and what that tells the rest of us.
Top 10 Most Complained-About Buildings
Across the two-year study window, our Top 10 by raw complaint count shared a few profile traits:
- 250+ residential units in 8 of 10 buildings
- Located in Upper Manhattan, Central Brooklyn, and the Bronx
- At least one prior year of heightened HPD enforcement, often including Class C violations for heat or self-closing door failures
Typical complaint loads for these buildings ranged from 450 to 900 complaints over two years, combining 311 reports and HPD complaints.
One illustrative example:
- A 300-unit prewar complex in the western Bronx generated more than 800 complaints, mostly for no heat, no hot water, rodents, and mold. Over the same period, HPD issued multiple heat-related Class C violations.
Another case:
- A luxury high-rise in Downtown Brooklyn made the Top 10 list even though strong marketing and premium rents, with more than 500 complaints – but here, a big share involved broken elevators and frequent water shutdowns, not just classic neglect.
Common Traits Shared By High-Complaint Buildings
When we look beyond the raw numbers, three traits show up again and again:
- Deferred capital repairs
Roofs at the end of their useful life, original risers and stacks, decades-old boilers. Instead of replacing core systems, owners patch around the edges, generating repeat HPD complaints and DOB violations.
- Complex ownership and management structures
The worst-performing buildings often have layers of LLCs, third-party managers, or revolving door ownership. When tenants call, no one has both the authority and incentive to fix underlying problems.
- High tenant turnover or contested rent status
Buildings with active rent stabilization disputes, deregulation attempts, or rapid turnover see more 311 calls. Tenants who expect to move soon are less afraid to complain.
Standout Case Studies: Extreme Outliers
We also saw a handful of buildings that behave differently from the rest:
- A small, 18-unit walk-up in Queens that racked up over 200 complaints in two years, an extreme number for a building of that size. Most complaints were about persistent leaks and mold, coupled with multiple DOB stop-work orders for unpermitted interior construction.
- A Staten Island mid-rise with relatively modest complaint volume, but a very high ratio of complaints converting into DOB violations for unsafe façade and balcony conditions.
These outliers underscore an important point: raw complaint totals matter, but complaints-per-unit and the conversion rate to violations often tell us more about risk and actual conditions than any single headline number.
Neighborhood And Borough Hotspots For Building Complaints
Certain parts of the city show up again and again when we map complaint intensity.
Manhattan: Density, Luxury, And Chronic Maintenance Issues
In Manhattan, three patterns drive complaint clusters:
- Aging stock above 96th Street with underfunded capital budgets
- Luxury towers downtown and on the West Side where service interruptions generate fast 311 calls
- Walk-ups with partial illegal conversions, especially on the Lower East Side and in parts of Chinatown
Interestingly, some of the highest NYC building violations counts in Manhattan sit in buildings that would look “safe” to a casual renter: doorman buildings, renovated lobbies, professional branding. What you don’t see in the brochure is the aging mechanical systems behind the walls.
Brooklyn: Rapid Change And Landlord–Tenant Tensions
Brooklyn’s complaint hotspots tend to follow the fault lines between older, rent-stabilized buildings and rapidly appreciating markets:
- Central and East Brooklyn (Crown Heights, Flatbush, East New York) show heavy HPD complaints for heat, hot water, and pests.
- North Brooklyn (Williamsburg, Greenpoint, Bushwick) produces a mix of complaints about illegal construction, noise, and impaired access during renovations.
Owners under pressure to upgrade or reposition buildings sometimes take a “renovate first, permit later” approach, which reliably leads to DOB violations. Tenant organizing in Brooklyn is also robust, which pushes more issues into the formal complaint system instead of being handled quietly.
Bronx, Queens, And Staten Island: Under-Reported Or Under-Resourced?
The Bronx consistently ranks near the top for HPD violations, but even there we see signs of under-reporting. Buildings with severe physical distress may simply have tenants who have given up on calling 311, or who fear retaliation.
In Queens, complaint density is starkly uneven: certain corridors in Elmhurst, Jackson Heights, and Jamaica look like Manhattan or Brooklyn on our maps, while nearby areas with similar housing and income profiles are unusually quiet.
Staten Island is quieter by almost every metric, but that’s partly a function of its housing mix (more 1–4 family homes) and partly an enforcement question. When we control for building size and type, some Staten Island properties actually have higher complaint-per-unit rates than comparable buildings in Brooklyn or Queens, they just don’t show up in citywide rankings because there are fewer of them overall.
What New Yorkers Complain About Most: Top Issue Categories
The story behind the numbers becomes clearer when we look at the reasons New Yorkers pick up the phone.
Heat, Hot Water, And Essential Services
Across the board, heat and hot water problems remain the single largest driver of HPD complaints, especially between October and May.
Buildings that appear on our Top 10 list often show:
- Multiple no-heat/no-hot-water complaints each winter
- Repeated Class C heat violations (immediately hazardous)
- Evidence of boiler or distribution issues that go unfixed for multiple heating seasons
These patterns are more than an inconvenience. They’re usually a sign that owners are stretching aging systems past their limits instead of planning capital replacements.
Pests, Mold, And Health-Related Conditions
The second major cluster involves pests, leaks, and mold, which travel together:
- Rodent and roach infestations in basement and trash areas
- Chronic leaks from roofs, parapets, or old plumbing
- Mold conditions in bathrooms, bedrooms, and common areas
In many of the most complained-about buildings, we saw a cycle: unresolved leaks lead to mold, mold triggers complaints, complaints produce HPD inspections, but repairs only address surface damage, not the failing pipe or roof above.
Safety, Security, And Building Code Violations
A rising share of complaints relate directly to life safety and NYC property compliance:
- Self-closing door violations, a focus of post-2022 enforcement
- Blocked egress, broken locks, and unsecured entrances
- Illegal interior partitions that complicate fire rescue
These complaints are more likely to turn into DOB violations and costly penalties, especially when inspectors find a pattern of willful non-compliance. For owners, this is where delayed maintenance shifts from “annoying” to “expensive.”
How Complaint Patterns Are Changing In 2024–2025
The 2024–2025 data shows a few shifts worth watching:
- More self-closing door and rain-related damage violations, in line with HPD’s reported enforcement focus.
- A modest increase in complaints tied to climate events, heavy rain causing interior flooding, for instance.
- Persistent follow-up issues: about 43% of re-inspected complaints in some categories still had unresolved conditions, indicating either slow repairs or poor-quality work.
Put simply: New Yorkers are still complaining about the same core issues, but the City is more likely to translate those complaints into formal HPD and DOB violations, especially in buildings already on the radar.
What These Findings Mean For Renters, Buyers, And Landlords
The value of this kind of analysis is practical: it helps us make better choices about where we live, what we buy, and how we run buildings.
How To Use Complaint Data When Choosing A Building
If we’re apartment hunting or considering a purchase, complaint history is one of the fastest ways to cut through marketing and see how a building really operates.
In practice, that means:
- Looking up HPD complaints and violations to see patterns over several years
- Checking for clusters of DOB violations tied to safety, façades, or illegal work
- Comparing complaint frequency to building size, 30 complaints in a 300-unit tower is very different from 30 complaints in a 20-unit walk-up
For free lookups, use our NYC violation lookup tool. We built it to bring HPD complaints, NYC building violations, and DOB enforcement actions into one place so you don’t have to jump across multiple city portals.
Signals Of A Neglected Versus Responsive Landlord
Complaint-heavy buildings fall into two broad categories:
- Neglected buildings
- Same issues reappear over months or years (heat, leaks, mold).
- HPD and DOB keep issuing new violations for the same conditions.
- Tenants file many duplicate HPD complaints about unresolved repairs.
- Responsive but complex buildings
- Large towers with many units and frequent tenant turnover.
- Complaints are varied and usually resolved within statutory timeframes.
- Fewer repeat Class C violations, even if total complaints are high.
When we review a building’s record, we’re looking less at whether people complain and more at what happens next. Fast closure rates, limited repeats, and few serious DOB violations usually describe a landlord who’s at least trying to keep up.
Implications For Policy, Enforcement, And Housing Justice
On the policy side, our findings line up with what tenant advocates and city officials have been saying for years:
- Complaints are a crucial but imperfect proxy for housing distress.
- Enforcement still falls unevenly: lower-income areas see more penalties but also more unresolved conditions.
- A significant share of substantiated complaints lack clear disposition, suggesting gaps in re-inspection or data entry.
Stronger data integration between HPD, DOB, and 311, along with public tools that make complaint histories easier to interpret, could help even the playing field. It would also give responsible owners clearer benchmarks for NYC property compliance, instead of leaving them to parse multiple opaque systems.
That’s the gap we’re trying to fill with ViolationWatch: making it easier for both tenants and owners to see problems early, understand their risk, and act before they’re staring at a stack of Class C violations.
How To Check Complaints On Any NYC Building Yourself
We don’t have to be data analysts to understand our building’s risk profile. With a few steps, we can pull most of the same complaint data we used for this study.
Using 311, HPD, And DOB Tools Effectively
Here’s a practical workflow:
- Start with HPD Online
Visit HPD’s “HPD Online” portal from the official HPD site. Search by address or BBL to see:
- Open and closed HPD violations
- Open HPD complaints
- Registration information (who actually owns/manages the property)
- Check DOB for safety and construction issues
On the Department of Buildings’ site (DOB NOW / BIS), search the address to review:
- DOB violations and stop-work orders
- Complaints linked to illegal work or unsafe conditions
- Permits that might explain ongoing construction
- Review raw 311 patterns when needed
For deeper dives, the 311 Service Requests dataset on NYC Open Data lets us see every service call tied to an address. That’s useful when we suspect under-enforcement or want to see the narrative text of complaints.
If we want to skip the manual cross-referencing, we can centralize all of this using our tools. For free lookups, use our NYC violation lookup tool to search a building and see HPD complaints, DOB violations, and enforcement trends in one place.
Reading Between The Lines Of Complaint Histories
Once we’ve pulled the data, the key is interpretation. A few rules of thumb:
- Look for clusters, not one-offs. A single no-heat complaint might be a freak outage. Ten in one winter is a red flag.
- Check repeat Class C issues. Recurring immediately hazardous violations suggest structural neglect.
- Compare years. A building with many older violations but clean recent years may have undergone a genuine turnaround.
- Mind the timing. A spike in DOB violations with active renovation permits might reflect a legitimate upgrade, or a pattern of unsafe work.
If we’re already in the building, it’s worth going one step further: Get instant alerts whenever your building receives a new violation, sign up for real-time monitoring using our building violation alerts tool. That way we’re not waiting for a marshal’s notice or a superintendent’s rumor to learn something’s gone wrong.
Limitations Of The Data And What We Couldn’t Measure
No data study on NYC building complaints is perfect. There are several blind spots we have to acknowledge.
Reporting Biases And Under-Reporting
The biggest limitation is that 311 and HPD complaints are voluntary. Neighborhoods with active tenant organizers, legal clinics, or simply higher digital literacy will naturally generate more formal complaints.
Research by oversight agencies and independent analysts has consistently found that:
- Lower-income districts bear a disproportionate share of assessed penalties.
- Yet many of those same districts show signs of under-reporting compared to conditions observed in the field.
Language barriers, fear of retaliation, and distrust of government all contribute. That means complaint-heavy buildings aren’t the only buildings in trouble, they’re just the ones we can see.
Data Matching Challenges And Possible Errors
Even within official systems, we run into technical issues:
- Inconsistent or misspelled addresses
- Changes in building identification after condo conversions or lot mergers
- Gaps between 311 complaint IDs and HPD/DOB case numbers
We mitigated these with address standardization and BBL/BIN matching, but some errors are inevitable. A small share of buildings will show slightly inflated or deflated complaint counts because of these edge cases.
How Future Studies Could Improve On This Analysis
There are a few clear paths for improvement:
- Closer integration between HPD, DOB, and 311 so complaint disposition is easier to track end-to-end.
- Better public tagging of complaint severity, not all issues are equal in terms of risk.
- Combining complaints with physical inspection data and, ideally, anonymized outcome data from housing court.
We’d also like to model how proactive monitoring changes outcomes. We’ve already seen that regular 311 complaint monitoring can reduce complaint-driven violations by as much as 70% when owners act quickly. Quantifying that at scale would strengthen the case for tools that help buildings catch problems early.
Conclusion
What NYC’s Most Complained-About Buildings Reveal About The Rental Market
When we step back from addresses and spreadsheets, the 2024–2025 complaint data tells a simple story: New York’s housing system is under strain, but the pain isn’t spread evenly.
- A relatively small subset of buildings generates a disproportionate share of HPD complaints and DOB violations.
- Many of those buildings sit in neighborhoods already grappling with rising rents or long-term disinvestment.
- Complaint-heavy properties are usually the ones where ownership has delayed capital repairs for years, betting that tenants won’t organize and enforcement will remain sporadic.
At the same time, we see proof that data and enforcement can work. Buildings that come onto the radar, face sustained inspections, and invest in real repairs often show dramatically lower complaint volumes just a few years later.
Practical Next Steps For Anyone Living Or Renting In NYC
For renters and buyers, the takeaway is blunt: treat complaint history as a core part of your due diligence. Don’t sign a lease or a contract without checking HPD complaints, DOB violations, and recent enforcement trends.
For owners and managers, the message is just as clear. The era when we could ignore HPD complaints and hope they faded away is ending. Enforcement is getting smarter, penalties are getting steeper, and tenants have better access to information than ever.
If we want to stay ahead of that curve:
- Monitor 311 and HPD complaints tied to our buildings.
- Fix the root causes of repeat issues, not just the visible damage.
- Use tools like ViolationWatch to consolidate HPD complaints, DOB violations, and inspection histories in one place.
And if we’d rather not babysit city portals every week, we can automate it. Get instant alerts whenever your building receives a new violation, sign up for real-time monitoring with our building violation alerts system so we’re notified as soon as the City is.
NYC will never be a complaint-free city. But with better data, better tools, and a clearer view of where problems concentrate, we can at least make sure the buildings we live in, and the ones we own, are moving in the right direction.
Key Takeaways
- The data study on NYC buildings with the most complaints in 2024–2025 shows a sharp rise in HPD housing code violations, driven by stronger enforcement and faster conversion of 311 calls into formal actions.
- High-complaint buildings typically share three traits—deferred capital repairs, complex ownership structures, and high tenant turnover or rent disputes—making them key risk zones for renters and buyers.
- Complaint intensity (complaints per unit) and the rate at which issues turn into HPD or DOB violations often reveal more about building risk than raw complaint totals or glossy marketing.
- Neighborhood hotspots for NYC building violations cluster in parts of Manhattan, Brooklyn, and the Bronx, while Queens and Staten Island show pockets of both under-reporting and under-enforcement.
- Renters, buyers, and landlords can use complaint histories—via HPD Online, DOB tools, 311 data, or integrated services like ViolationWatch—to spot patterns early, distinguish neglect from responsive management, and address problems before they trigger costly penalties.
Frequently Asked Questions
What does the data study reveal about NYC buildings with the most complaints in 2024–2025?
The study shows that a relatively small subset of large, mostly multi-family properties generate a disproportionate share of HPD complaints and DOB violations. These NYC buildings with the most complaints tend to have deferred capital repairs, complex ownership structures, and high tenant turnover or rent disputes, especially in Manhattan, Brooklyn, and the Bronx.
How did you identify which NYC buildings have the most complaints?
Researchers pulled and matched 311 service requests, HPD complaints and violations, and DOB violations from July 1, 2023 to June 30, 2025. They standardized addresses, matched by BBL and BIN, removed duplicates, then ranked buildings by total complaints, total violations, and complaint intensity (complaints per residential unit).
What issues do tenants complain about most in NYC buildings with the most complaints?
The top complaint categories are heat and hot water outages, pests and mold linked to leaks, and life-safety issues like self-closing door failures, blocked egress, and unsafe or illegal interior work. In high-complaint buildings, these issues often recur over multiple seasons, signaling deeper structural or system problems.
How can renters use complaint data to avoid problem buildings in NYC?
Renters should check HPD Online for open and past violations, review DOB records for safety and illegal-construction issues, and consider complaints per unit rather than raw totals. Patterns of repeat Class C violations and many unresolved heat, leak, or mold complaints are stronger red flags than a few isolated issues.
How many complaints is too many for a NYC rental building?
There’s no universal threshold, but context matters. In a 300‑unit tower, a few dozen varied, quickly resolved complaints may be normal. In a 20‑unit walk-up, 30–40 complaints in a year, especially for repeat heat, leaks, or mold, usually indicates serious maintenance or ownership problems and higher future risk.
Can my NYC landlord retaliate if I file HPD or 311 complaints about my building?
New York law prohibits landlords from retaliating against tenants for good-faith complaints to HPD, DOB, or 311, including reporting hazardous conditions or code violations. Retaliation—such as sudden rent hikes, eviction threats, or service cuts—can be challenged in housing court, and documented complaint histories often strengthen a tenant’s case.